HOW TO MONITOR NETWORK BANDWIDTH WITH VNSTAT
- Category : Server Administration
- Posted on : Feb 20, 2016
- Views : 1,515
- By : Tadashi P.
vnStat is a console-based network traffic monitor for Linux and BSD that keeps a log of network traffic for the selected interface(s). It uses the network interface statistics provided by the kernel as information source. This means that vnstat won’t actually be sniffing any traffic and also ensures light use of system resources. However, in Linux at least a 2.2 series kernel is required.
It is very simple to install and use. It can monitor multiple network interfaces at the same time. It will display the output summary in hourly, daily, weekly and as well as monthly basis. And it can be used without root permissions.
Install vnstat
On Debian/Ubuntu:
1 user@centriohost# sudo apt-get install vnstat
On RHEL/CentOS:
vnstat will not be found in Official repositories, so add EPEL repository to install vnstat:
1 [root@server ~]# rpm -ivh http://dl.fedoraproject.org/pub/epel/6/i386/epel-release-6-8.noarch.rpm
Install vnstat with following command:
1 [root@server ~]# yum install vnstat -y
Usage
To view all network interfaces statistics, enter the following command:
1 user@centriohost# vnstat
This shows network bandwidth usage of all network interfaces:
rx / tx / total / estimatedeth1:Jul '13 4.77 MiB / 204 KiB / 4.97 MiB / 0 KiBtoday 4.77 MiB / 204 KiB / 4.97 MiB / --wlan0: Not enough data available yet.eth0: Not enough data available yet.
To view a particular interface bandwidth usage, enter the command:
1 user@centriohost# vnstat -i eth1
The above command will display the bandwidth usage of eth1:
Database updated: Thu Jul 4 13:26:10 2013eth1 since 07/04/13rx: 4.82 MiB tx: 249 KiB total: 5.07 MiBmonthlyrx | tx | total | avg. rate------------------------+-------------+-------------+---------------Jul '13 4.82 MiB | 249 KiB | 5.07 MiB | 0.13 kbit/s------------------------+-------------+-------------+---------------estimated -- | -- | -- |dailyrx | tx | total | avg. rate------------------------+-------------+-------------+---------------today 4.82 MiB | 249 KiB | 5.07 MiB | 0.86 kbit/s------------------------+-------------+-------------+---------------estimated -- | -- | -- |
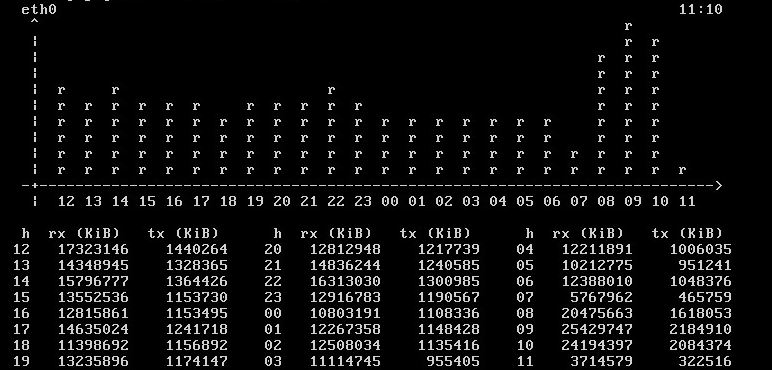
To view the hourly usage, use the parameter “-h” without quotes:
user@centriohost# vnstat -i eth1 -heth1 13:31^ r| r| r| r| r| r| r| r| r| r-+--------------------------------------------------------------------------->| 14 15 16 17 18 19 20 21 22 23 00 01 02 03 04 05 06 07 08 09 10 11 12 13h rx (KiB) tx (KiB) h rx (KiB) tx (KiB) h rx (KiB) tx (KiB)14 0 0 22 0 0 06 0 015 0 0 23 0 0 07 0 016 0 0 00 0 0 08 0 017 0 0 01 0 0 09 0 018 0 0 02 0 0 10 0 019 0 0 03 0 0 11 0 020 0 0 04 0 0 12 0 021 0 0 05 0 0 13 4964 290
To view daily usage, use the parameter “-d”:
user@centriohostt# vnstat -i eth1 -deth1 / dailyday rx | tx | total | avg. rate------------------------+-------------+-------------+---------------07/04/13 4.82 MiB | 249 KiB | 5.07 MiB | 0.86 kbit/s------------------------+-------------+-------------+---------------estimated -- | -- | -- |To view weekly usage, use the parameter “-w”:
user@centriohostt# vnstat -i eth1 -weth1 / weeklyrx | tx | total | avg. rate---------------------------+-------------+-------------+---------------last 7 days 4.85 MiB | 290 KiB | 5.13 MiB | 0.07 kbit/scurrent week 4.85 MiB | 290 KiB | 5.13 MiB | 0.14 kbit/s---------------------------+-------------+-------------+---------------estimated -- | -- | -- |
And to view monthly usage, use “-m”:
user@centriohost# vnstat -i eth1 -meth1 / monthlymonth rx | tx | total | avg. rate------------------------+-------------+-------------+---------------Jul '13 4.85 MiB | 290 KiB | 5.13 MiB | 0.14 kbit/s------------------------+-------------+-------------+---------------estimated -- | -- | -- |
To see top ten network bandwidth usage of eth1:
1 user@centriohostt# vnstat -i eth1 -t
To view the bandwidth usage of 5 seconds, enter the following command:
1 user@centriohost# vnstat -i eth1 -tr
To view the usage of 10 seconds, enter the following command:
1 user@centriohost# vnstat -i eth1 -tr 10
Finally to see the real live bandwidth usage of eth1:
1 user@centriohost# vnstat -i eth1 -l
This command will collect the network bandwidth usage of eth1. You can stop the process by pressing CTRL+C at any time.
Sample Output:
Monitoring eth1... (press CTRL-C to stop)rx: 0 kbit/s 0 p/s tx: 0 kbit/s 0 p/srx: 0 kbit/s 0 p/s tx: 0 kbit/s 0 p/s^Ceth1 / traffic statisticsrx | tx--------------------------------------+------------------bytes 17.96 MiB | 4.48 MiB--------------------------------------+------------------max 3.78 Mbit/s | 420 kbit/saverage 31.62 kbit/s | 7.90 kbit/smin 0 kbit/s | 0 kbit/s--------------------------------------+------------------packets 22511 | 21780--------------------------------------+------------------max 336 p/s | 206 p/saverage 4 p/s | 4 p/smin 0 p/s | 0 p/s--------------------------------------+------------------time 77.55 minutes
Categories
Subscribe Now
10,000 successful online businessmen like to have our content directly delivered to their inbox. Subscribe to our newsletter!Archive Calendar
Sat | Sun | Mon | Tue | Wed | Thu | Fri |
---|---|---|---|---|---|---|
1 | ||||||
2 | 3 | 4 | 5 | 6 | 7 | 8 |
9 | 10 | 11 | 12 | 13 | 14 | 15 |
16 | 17 | 18 | 19 | 20 | 21 | 22 |
23 | 24 | 25 | 26 | 27 | 28 | 29 |
30 |
Recent Articles
-
Posted on : Jul 25
-
Posted on : Jul 07
-
Posted on : Apr 07
-
Posted on : Mar 19
Optimized my.cnf configuration for MySQL 8 (on cPanel/WHM servers)
Tags
- layer 7
- tweak
- kill
- process
- sql
- Knowledge
- vpn
- seo vpn
- wireguard
- webmail
- ddos mitigation
- attack
- ddos
- DMARC
- server load
- Development
- nginx
- php-fpm
- cheap vpn
- Hosting Security
- xampp
- Plesk
- cpulimit
- VPS Hosting
- smtp
- smtp relay
- exim
- Comparison
- cpu
- WHM
- mariadb
- encryption
- sysstat
- optimize
- Link Building
- apache
- centos
- Small Business
- VPS
- Error
- SSD Hosting
- Networking
- optimization
- DNS
- mysql
- ubuntu
- Linux